Hello everyone,
I took some time to investigate an inconvenience some Pharo users have when working with large heaps. Basically, the current VM is quite slow when growing the image from the base 50Mb to multiple Gbs. The slow down kicks in when the image grows by at least a couple hundreds Mb. We have now a Pharo consortium members with 64 bits images up to 6.85Gb where the slow down can be significant in uncommon cases.
In this post I will briefly explain how the Spur garbage collector (GC) works and reference papers explaining the inner details. I will then discuss the main settings that one can change from Pharo, how to change them and how they impact the runtime. These settings can be used to tune the garbage collector, leading to important performance boost on large heaps. Lastly, I will report some experience I had tuning the GC.
Spur GC overview
The heap is the memory zone holding all objects. Because most objects have a short life-time (usually 99% of objects do not survive their first GC), the heap is split in two. In the low addresses is new space, which includes most objects recently allocated. In the upper addresses is old space, which includes long-lived objects. The GC is in most case performed only on new space as it is likely to free a lot of space very quickly. The GC is started on the whole heap only when old space grows by a significant amount.
At runtime, the heap is represented in memory through multiple mmap’ed segments. At start-up, the first segment is allocated and includes new space and the beginning of old space. All objects from the snapshot plus some headroom are present in the first segment. Further old space segments are allocated or freed at runtime to store other old objects. The figure below shows the heap memory representation for a running application :
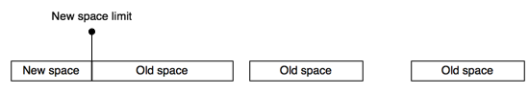
New space
Let’s zoom in on new space. New space is split in three main parts. On the low addresses are the survivor 1 and 2 spaces. Each survivor space represent 1/7th of new space. On the high addresses is Eden. The following figure represents new space:
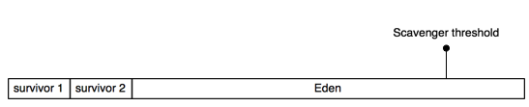
Eden is the place where most objects are born. Primitives such as #basicNew, #basicNew: or #shallowCopy usually allocate objects in Eden. NewSpace’s GC is an implementation of Dave Ungar’s Generation scavenger [1]. The following paragraphs summarise the algorithm.
Let’s say we start a new application. Just after start-up, new space is entirely empty (all objects loaded from snapshots are old). During the application execution, objects are allocated from the low addresses of Eden to the high addresses. At some point, the allocation of an object reaches the scavenger threshold. This allocation schedules a scavenge. At the next interrupt point (typically, the next message send or the next back jump), a scavenge will be performed.
The scavenger garbage collects new space. It does a breadth-first traversal of objects from the remembered table (a table holding all old objects referencing new objects) and the stack. Each time a young object is reached, it is moved to one of the survivor space and its original location is replaced by a forwarding object. Usually, 1% of objects survive their first scavenge. As Eden is 5 times bigger than the survivor space, around 5% of the survivor space may be filled at each scavenge with objects from Eden. All pointers to moved young objects are updated using the forwarding object to the new addresses. Eden is then considered as free.
At the second scavenge, the same process is repeated but the scavenger may move objects both from Eden and the active survivor space. The surviving objects are copied into the other survivor space. Only one survivor space is active at a time, but both are needed for efficient scavenges (moved objects are replaced by a forwarding object to update the pointers later).
For the first ~20 scavenges, objects are just moved from Eden and survivor space to the other survivor space. Then, at some point, the scavenger detects a change in the objects demography: the survivor space is now filled at more than 90% of its capacity, showing that objects are ageing. When this happens, the scavenger schedules a tenure by age. Tenuring is the process of promoting an object from new space to old space.
The tenure by age algorithm [2] sets up a tenure threshold in the active survivor space. Because of the bread-first search in scavenges, objects are usually sorted by age in the survivor space (the oldest object is on the lower addresses). During a scavenge with a tenure by age, all objects under the tenure threshold are promoted to old space.
We note three exceptional cases:
- If when moving a object to the survivor space, the survivor space is already full, the scavenger promotes it early to old space.
- Most objects are allocated in Eden, but not all of them. Very large objects (objects which size cannot be encoded in 16 bits) are allocated directly in old space.
- Most tenures are done by age. However, in specific applications, the scavenger does special tenures to decrease the size of the remembered table.
Old space
Old space segments can be of two kinds. Very large objects have their own mmap’ed segments. Other segments hold many objects. Due to the compaction phase in the full GC, old space segments have objects in the low addresses and available headroom in the high addresses. The following figure shows the different segments:
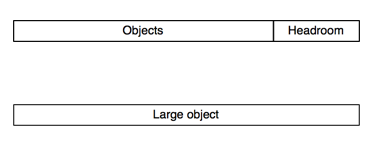
At start-up, a little bit of headroom is allocated to be able to perform tenures and large objects allocations without allocating new segments. Once one object needs to be moved/allocated in old space but there are not enough space in any of the available old space segments, a new segment is mmap’ed to grow old space.
Once the heap has increased by a specific ratio, a full GC is triggered. The full GC is a traditional mark, sweep and compact algorithm. Objects are traversed from the stack and all live objects are marked. The full GC then frees the memory of all unreachable objects. Lastly, the full GC compacts the memory to low addresses. Once full GC is done, if some segments are unused and there is enough headroom, they may be freed, shrinking the heap, for the OS to do something else with this memory.
GC tuning
We have 4 main settings to look at when tuning the GC for growing or large heaps.
Tuning new space size
New space size is the size of Eden and survivor 1 & 2. Each survivor is always 5 times smaller than Eden (Eden is 5/7 of new space, a survivor is 1/7 of new space). Increasing the size of Eden wastes a bit of memory but decrease the overall time spent in scavenges.
The scavenge pause (the duration of a scavenge, in which the application is interrupted) is proportional to the number of objects that survive the scavenge. If Eden is larger, a smaller proportion of objects is likely to survive each scavenge. Hence, increasing the size of Eden does not increase proportionally the scavenge pause – in my measurements in a specific application, increasing Eden size by 2.5 times increased by 1.5 the pause time (from 0,6 to 0,9 ms of pause time).
If during profiling, the application seems to be spending a considerable amount of time in scavenges (typically when growing memory from 50Mb to multiple Gbs), then one may consider to increase Eden size.
Eden is currently by default at 3.8Mb. Some of our users set the size of Eden to 64Mb instead. 64Mb is quite big, but values such as 16Mb are reasonable and in many cases can lead to significant speed-up.
To tune Eden size, one needs to set the VM parameter 45. VM parameter 44 holds the current size of Eden while parameter 45 holds the desired Eden size. One needs to restart the image to increase Eden size.
An example script would be:
Smalltalk vm parameterAt: 45 put: (Smalltalk vm parameterAt: 44) * 4.
And then restart the image.
Tuning the growth headroom
The growth headroom is the minimum size of the next segment that will be mmap’ed by the VM when tenuring or allocating a large object and the old space segments have not enough free space. If the program is allocating a large object, the segment will be big enough to hold it (hence potentially bigger than the growth headroom). Alternatively, the new segment has the growth headroom size.
If during profiling, the application seems to request many new segments or is using many segments, one may consider increasing the growth headroom.
Increasing growth headroom may waste a bit of memory but decrease the time spent mmap’ing new segments.
The growth headroom is parameter 25.
An example script to increase it would be:
Smalltalk vm parameterAt: 25 put: (Smalltalk vm parameterAt: 25) * 2.
Tuning the shrink threshold
The shrink threshold is the maximum allowed amount of free space in old space after the full GC. If more free space is available, the full GC frees memory segments to the OS until it has less headroom than the shrink threshold. The full GC does not shrink memory if there are less than the growth headroom available, whatever the shrink threshold is.
If during profiling, the application seems to free many segments (the application requires old space to grow and shrink multiple times), one may consider increasing the shrink threshold.
Increasing the shrink threshold may waste a bit of memory but decrease the time spent freeing new segments, leading to less requests to mmap new segments.
The shrink threshold is parameter 24.
An example script to tune it would be:
Smalltalk vm parameterAt: 24 put: (Smalltalk vm parameterAt: 24) * 2.
Tuning the full GC ratio
Once the heap has grown by a specific ratio, the full GC is started. By default this setting is set at 0.33, so if the heap has grown by 33% a full GC happens after the next scavenge.
If during profiling, the application seems to do many full GCs, it may be worth it to increase the full GC ratio. Specifically, if one knows the application will grow memory by a significant amount (from 50Mb to multiple Gb for example), it may be worth it to drastically increase the full GC ratio. Growing form 50Mb to 8Gb requires 20 full GC with the current setting, while one could put the ratio to 200.0 during the memory growth to completely avoid full GCs during memory growth and to perform a full GC once the memory has grown. The full GC ratio can then be set up to another value once the memory has reached its peak value.
The full GC ratio is parameter 55.
An example script to tune it would be:
Smalltalk vm parameterAt: 55 put: 2.5.
Note that the full GC ratio has to be a float (setting the parameter to an integer will fail).
Experience report
Here are some cases I studied recently.
Loading a 200Mb Moose model
People from the Moose community have reported that loading a Moose Model takes more time with Spur VMs than with pre-Spur VMs. The Moose community is working on software analysis and a Moose model is the representation of the code of an application.
To investigate the problem, Vincent Blondeau and I loaded a 200Mb Moose model on a 250Mb image, growing the image to 450Mb. Loading such a model with a VM from January 2017 takes 2 minutes in Spur and 1m30s in pre-Spur VMs.
Using the stable Pharo VM, the analysis results were the following:
- total time spent to load the Model: 2 minutes
- time spent in full GC: 1 minute (4 fullGCs)
- time spent in scavenges: 15 seconds
On the 2 minutes spent, we have 50% of the time spent in full GCs, 12.5% in scavenges, 37.5% executing code.
We then used the latest VM that features the new compactor (VM from beginning of March 2017 and over). The full GC execution time went down from 1 minute to 2 seconds.
In addition, we increased the size of Eden from 4Mb to 12Mb. Time spent in scavenges decreased from 15 seconds to 5 seconds.
Overall, loading the model is now taking around 50 seconds instead of 2 minutes.
A non compacting large image
Recently, a Pharo consortium member reported he had a 500Mb image that would not get compacted. The image stayed at 500Mb while the application was not running and no state was kept in globals or anywhere in the image. He thought the problem was likely to be related to the compactor as the image was not compacted. In addition, the image took 1m30sec to start-up on Windows.
I investigated with him the image. We analysed the memory and the results were that all the 500Mb were used, that was the reason why the full GC was not compacting anything. So we had to investigate other directions to solve the problem.
All the development of the application was done in the same Pharo 5 image. In Pharo 5, there are known memory leaks when copy-pasting code or printing code in the GT tools. As all the developments had happened in the same image, the memory wasted by memory leaks had become significant. Pavel Krivanek provided me with a script to clean-up the known memory leaks:
FreeTypeCache cleanUp.

Clipboard startUp: true.

RubEditingState allInstances do: [ :each |

    each instVarNamed: #undoManager put: nil].

GTPlayBook reset.

EditorFindReplaceDialogWindow cleanUp.

ActiveHand resetClickState; releaseAllFocus.

UITheme current focusIndicator: nil.

40 timesRepeat: [

    1 second wait.

    World doOneCycle ].
The image went down from 500Mb to 150Mb.
We also investigated the start-up performance. The image had a setting checked (in the setting browser) to load all free type fonts at start-up. Around 700 different fonts were loaded at start-up, taking 1m30sec. Unchecking this setting decreased start-up time from 1m30sec to less than 1 second.
I am reporting this second case, even if this was not due to GC bug to relate a bit what we are experiencing working in the VM. Most bugs reported as VM bugs are in fact not related to the VM but related to something else like in this case. A couple weeks ago, I remember Esteban Lorenzano was trying to fix a reported bug on FFI call-backs in the Athens library, which was in fact due to in-image code changes. It is very difficult to know where some problem come from and no one should be blamed to report incorrectly a bug – we will always investigate the reported problems. I just wanted to relate what we are experiencing.
An application with large arrays
One last interesting experience was the following: a Pharo consortium member explained that his application was slow due to #shallowCopy primitive failures. He provided a Pharo image with a benchmark showing how his application behaves. His application is a model-checker. In term of object allocations, the application is almost only allocating large arrays (arrays of size ~1,000,000). In this case, as most objects allocated are large (their sizes do not fit in 16 bits), the VM allocate most objects directly in old space.
As many objects were allocated directly in old space, old space was frequently running out of headroom (especially, it needed enough headroom to store a large array, which means a large chunk of contiguous memory needed to be available). As there was not enough headroom, the allocation primitive (#shallowCopy or #new:) failed often. Upon failure, in-image code is responsible to try to run a full GC to free memory and to request the mmap’ing of a new segment through another primitive if the full GC has not freed enough memory. Once done, in-image code retries to allocate the object.
At each primitive failure, a full GC was run to try to free memory. Then, sometimes a new segment was mmap’ed to store the new large array. In other cases, many arrays had become dead and segments were freed by the full GC. Overall the VM was mmap’ing and freeing many segments, and many full GCs were executed.
I multiplied by four the growth headroom and the shrink threshold. By doing so, there was always lots of headroom in old space. Many allocation primitives stopped failing because there was enough headroom to allocate the large arrays, drastically reducing the number of full GCs done in the benchmark. The remaining primitive failures were able, through a full GC, to free enough space to allocate the large array. The VM completely stopped mmap’ing and freeing segment once the first segments were allocated (the same segments were reused instead of mmap’ing and freeing different segments). The performance of the benchmark drastically improved.
This experience was interesting because it is the only time I saw an application with no time spent in scavenges (there was no scavenges at all during the benchmark) but many time spent in full GCs.
Further tuning
If performance really matters and you want to tune the GC for your application, don’t hesitate to contact someone from the VM development team, such as me, directly. There are other VM parameters that can impact the performance of your application. I will try to write about them in further posts but I am very busy so it may be a while before I do so.
If you contact me, I can help you tune the VM for your application, or forward you to another consultant that can do it, such as Eliot Miranda, for decent consulting rates (or as part of the Pharo consortium member included support days if that applies to you).
Thanks for reading,
PS: I have not written anything on this blog for a while because I have been writing my Ph.D thesis. I have now written most of it and I should be able to post on the blog more frequently.
[1] Generation Scavenging, A Non-disruptive, High-Performance Storage Reclamation Algorithm. David Ungar.
[2] An adaptive tenuring policy for generation scavengers. David Ungar & Frank Jackson.

Thanks so much. Have only read once, but been waiting for this for years. Really good!
I am glad you liked the post. May I ask, what are you doing with Pharo ? In which company are you in ?
A nice thing to have in the upcoming versions of Squeak/Pharo :
A “MemoryPolicy” (similar to what they have in VisualWorks) hierarchy of classes so fine-tuning memory allocation, scavenging, low space conditions, full and incremental garbage collection, etc. is “nicer” and more object-oriented than having to rely on code like “Smalltalk vm parameterAt: 55 put: 2.5.”
Sure. The VM parameterAt: and parameterAt:put: are the interface between the image and the VM, as in VW they have multiple primitives for the same interface. One can build in the image higher level APIs such as MemoryPolicy instances.
I was thinking of doing something like that actually. The first step is to add some convenient APIs in the VirtualMachine class, like getters and setters to change these parameters.
MemoryPolicies may be built on top. Even if we have a default set of 3 different policies (small heap policy, large heap policy and growing heap policy), some application need a user-defined policy (such as the application with large arrays I described in the post) and it has to be possible to build such policy without interacting directly with the low-level APIs.
Pingback: Tuning the Pharo GC | Weekly news about Pharo
Pingback: Paramétrer le garbage collector de Pharo | L'Endormitoire
If I understood correctly, only the new space size tuning needs a restart of the image? Thus if we need to something and we know we don’t want full GC we could:
– Change the full GC ratio
– Perform what we want
– Reset the full GC ratio
– Perform a full GC
Yes you can do that. You put the full GC ratio very high, you load your code, you reset it and call it once manually. You need to be careful with things like memory overflow (it triggers a full GC from the image).
With the old compactor it made sense to disable the full GC but with the new compactor (used since the beginning of March) I see ~3.5% of execution time spent in full GCs while growing an image from 250Mb to 450Mb so I don’t think disabling the full GC really make sense. Maybe on larger images ?
You can evaluate the time spent in full GCs and the number of full GCs reading other VM parameters (see comment in parameterAt:). When I worked with Vincent I moved part of my scripts into a class that I put here to make it easier to understand what is going on: http://smalltalkhub.com/#!/~ClementBera/MemoryAnalyser. Then you can try to evaluate what is worth it.